Experiment
Goals and achievements
Step 1. Verification of the parts designed
Step 2. Formation of the microscale structure
Step 2-1. Fluorescent microscopy
Step 2-2. AFM observation
Step 3. Transition of the tile sheet into a sphere
Step 3-1. Effect of Capture DNA (Fluorescent microscopy)
Step 3-2. Size shifts after Capture DNA addition
Step 4. Wrapping substance by 3D spherical structure
Experiment 1. Formation of the components required for building DNA tiles
Purpose
To confirm that two unit motifs necessary for our design-three-point-star(TPS) and dsDNA joint are formed as intended.
Methods
Each component strands of TPS and dsDNA joints were annealed in the following combination given in parentheses and the products were analyzed by PAGE (please see protocol more details).
Results

Fig.1 Confirmation of the parts for TPS by PAGE
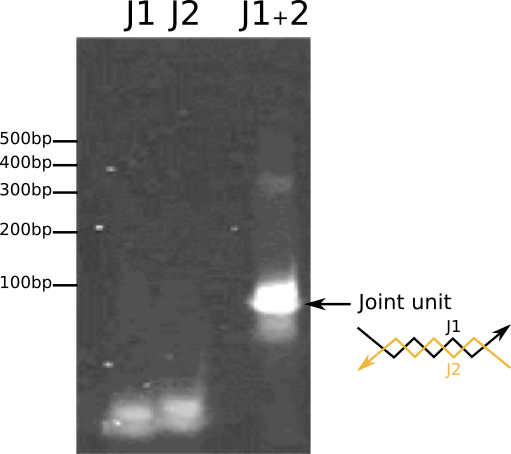
Fig.2. Confirmation of the parts for joint dsDNA by PAGE
The bands which correspond to three-point-star motifs and dsDNA joints were observed in Fig. 1 and Fig. 2, respectively.
Conclusion
We successfully obtained DNA units (three-point-star structure and joint dsDNA) as designed.
Experiment 2. Formation of the microscale structure (DNA tile)
This experiment consists of two steps, 2-1 and 2-2.
Purpose
To confirm the proper formation of DNA tiles when the components of three-point-star and joint is annealed at the same time.
2-1. Fluorescent microscopy
Methods
The component strands of TPS motifs (T1, T2 and T3) and those of dsDNA joints (J1 and J2) were mixed at the same time and the annealing product was observed with fluorescent microscope. Also, all the TPS components (T1, T2 and T3) and only J1 were annealed as a negative control. DNA tiles were stained with MIDORI Green (Nippon genetics)
link: Concentrations of components
link: Annealing protocol
Results
Following images were obtained in this step.
Fig.3 The product of TPS + dsDNA joint
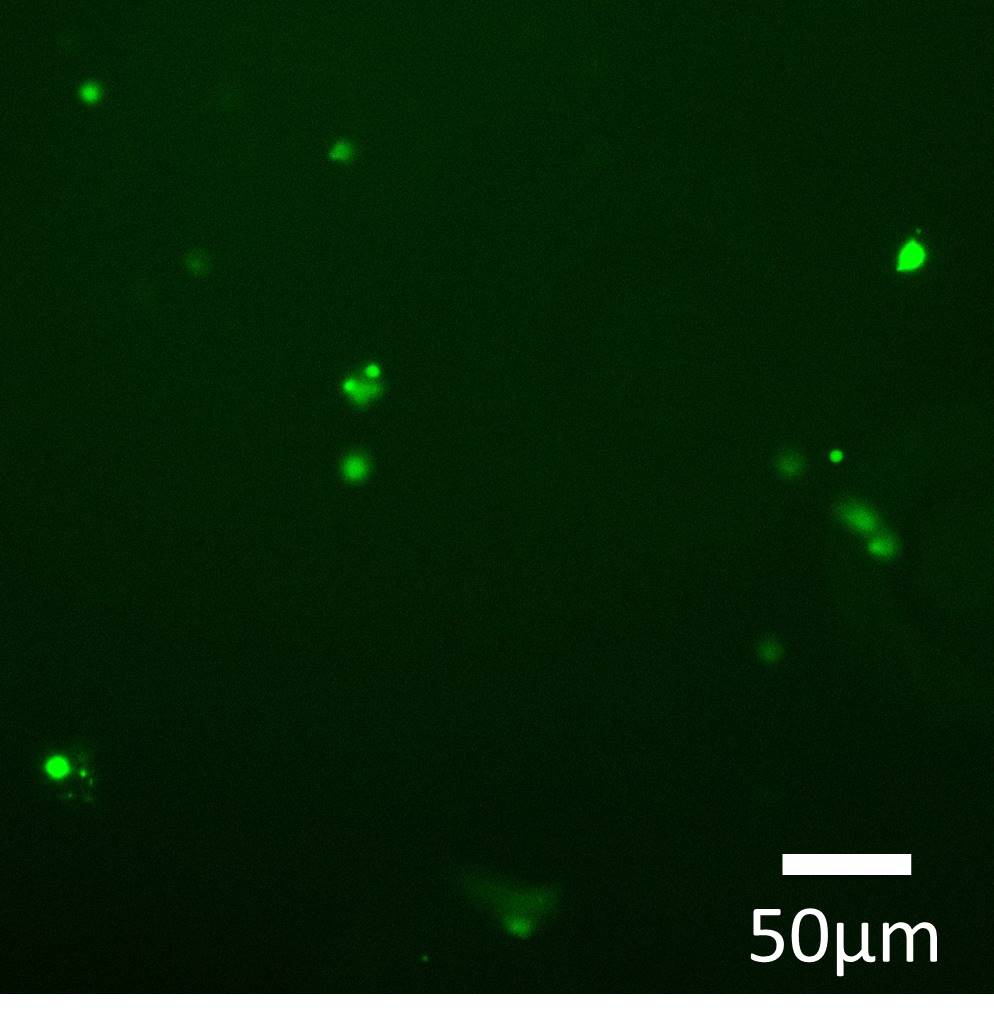
Fig.4 control-TPS + ssDNA joint (J1 only)
In each case, micro-scale structure was observed (Green color).
To evaluate sizes of structures, the sizes of the DNA tile sheet by fluorescence area were shown as histograms.

Fig.5 Histogram of the TPS + dsDNA structure
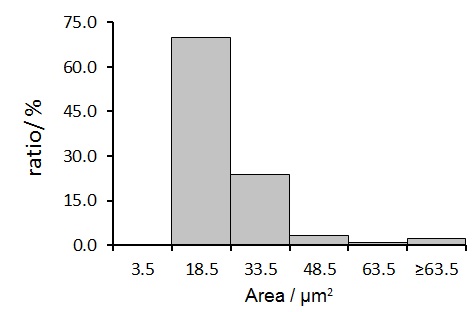
Fig.6 Histogram of the TPS + ssDNA structure (J1 only)
The average square area of TPS + dsDNA product is calculated as (41.9±32.6) \({um}^2\) and that of TPS + ssDNA product (control) is (17.0±16.8) \({um}^2\). Student’s t-test indicated that the difference of these size distributions is significant (p < 0.05).
2-2. AFM observation
Methods
The annealed product of TPS and dsDNA joints (the same products in 2-1) was put on mica and was observed with AFM.
Results
By AFM, honeycomb-like striped pattern was observed.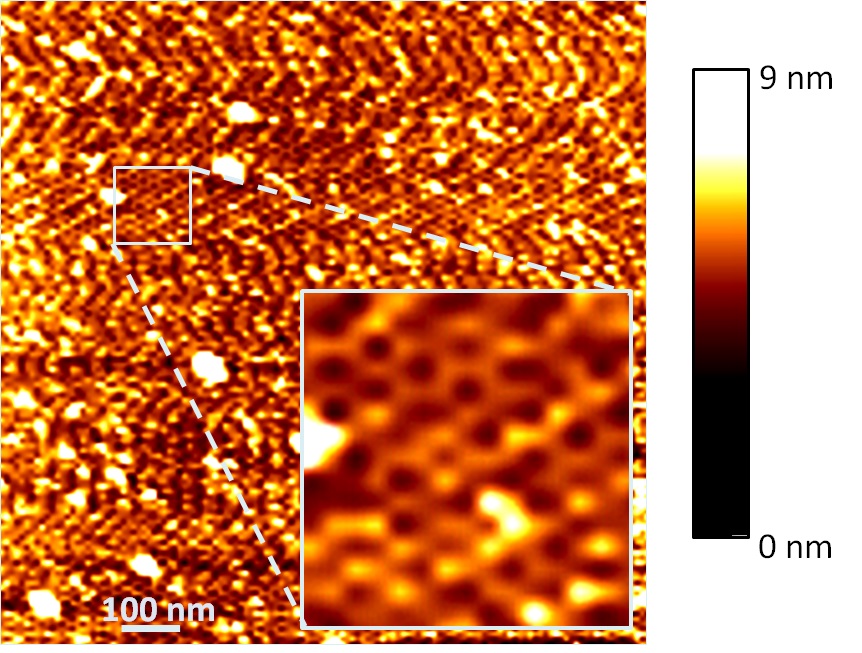
Fig.7. The AFM image of the structure made of our TPS structure and the dsDNA joints.
The color bar indicates the height of the objects at points. Expanded image of a net region was expanded in the inlet.
Conclusion
AFM supports the DNA tile formation by TPS and dsDNA joint units.
Experiment 3. Transition of the tile into a sphere
This experimental section consists of two steps, 3-1 and 3-2.
Purpose
To confirm transition of the 2D tile sheet into 3D spherical structure by adding Capture DNA (the complementary sequence of J2)
3-1. Fluorescent microscopy
Methods
Capture DNA was added to the 2D tile structure made of the TPS and dsDNA joint, and the resultant product was observed with fluorescent microscope. Also the area of the products was measured to evaluate shifts of size distributions.
Results
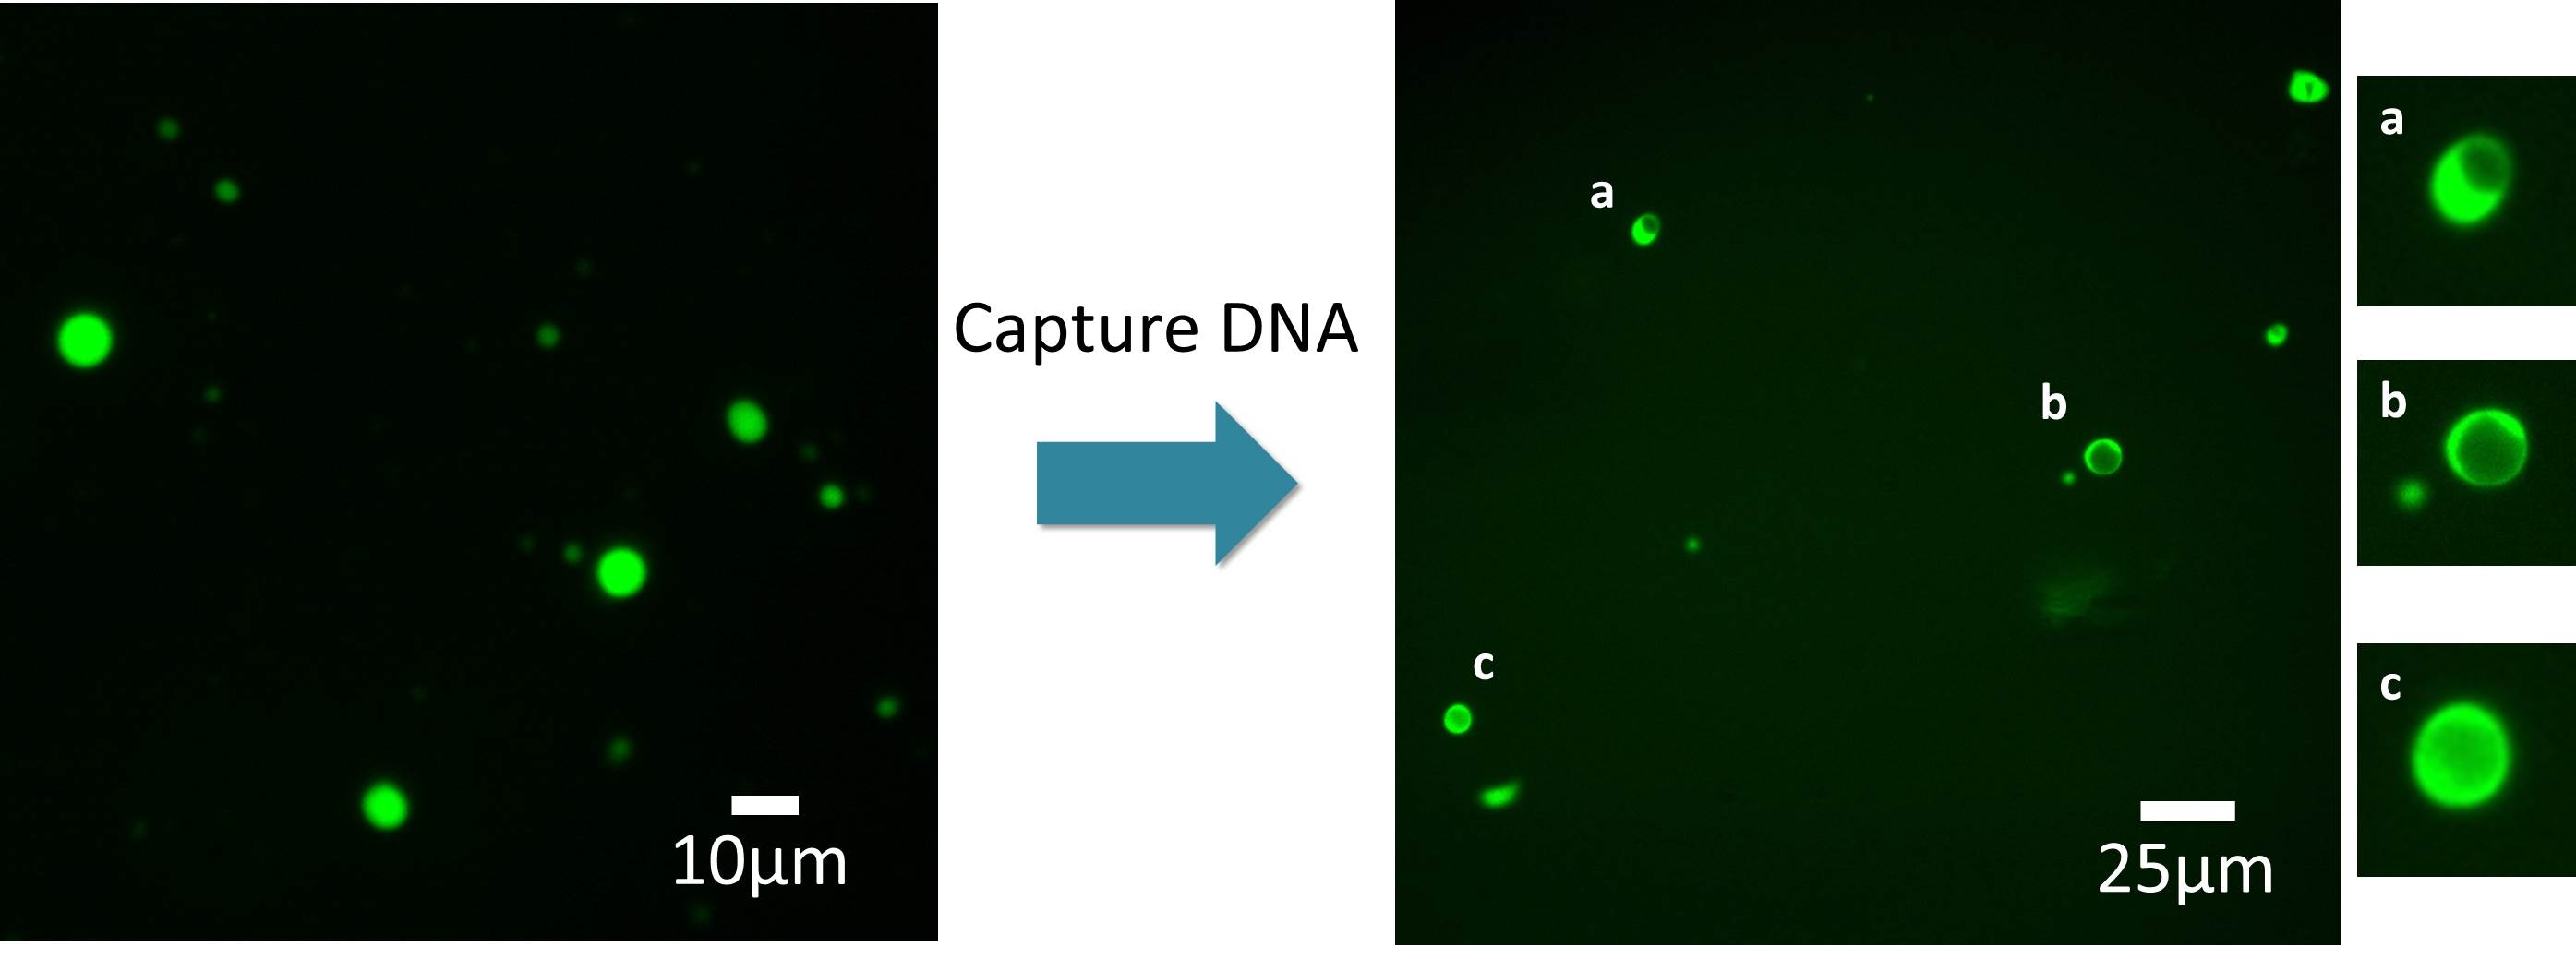
Fig.8 Fluorescent images of the tile structure before after addition of Capture DNA
(Left: before addition, Right: after addition. Different fields were shown)
In the fluorescence image shown in Fig. 8, there seems to be a blank in the center of each spherical structure. Such images are frequently obtained dependent on the focal distance of Z axis, when observing hollow structure like liposome. Thus, the image indicated the possibility of the structural change of 2D tile sheet into 3D hollow sphere.
3-2. Size shifts after Capture DNA addition
Methods
Surface areas of the DNA structures were estimated from the fluorescent images by ImageJ (NIH).
Results
The following histograms show the size distribution of the assembled structure of TPS and dsDNA joint before and after the addition of Capture DNA.
Fig.9 Histograms of the TPS + dsDNA structure before and after addition of Capture DNA
Addition of Capture DNA changes the average area of the structure from 41.9±32.6 \({um}^2\) to 12.1±10.8 \({um}^2\).
By the statistic values of the sizes, we further evaluated the possibility of transition from plane to sphere through the calculation shown below.
The average square areas of the circle observed in fluorescent images before and after Capture sequence was added are as follows. Here, standard errors were shown.
\(Before\ adding\ Capture\ sequence \rightarrow (41.9±3.4)\times {um}^2\\ After\ adding\ Capture\ sequence \rightarrow (12.1±1.9)\times {um}^2\\ \cfrac{After\ adding\ Capture\ sequence}{Before\ adding\ Capture\ sequence} = 0.23 \sim 0.36 {um}^2\)
Square area of a circle with \(r\) as radius is \(πr^2\). If the surface area of a sphere with \(R\) as radius is the same as square area of the circle, \(R = \cfrac{r}{2}\) since the surface area of the sphere is \(4πr^2\). Therefore, expected transition of surface area by the addition of Capture DNA is \(\cfrac{1}{4}(=0.25)\). This value consists with our static results above.Experiment 4. Wrapping substance by 3D spherical structure
Purpose
To verify that sphere-like structure can wrap micro-scale objects
Methods
200nm beads were added before Capture DNA was added in the experiment 3, and the products were observed with a fluorescent microscope.
link: See protocol in detail.
Results
The possibility is quite low, but we finally found a sphere-like structure which encapsulated 200nm beads inside.
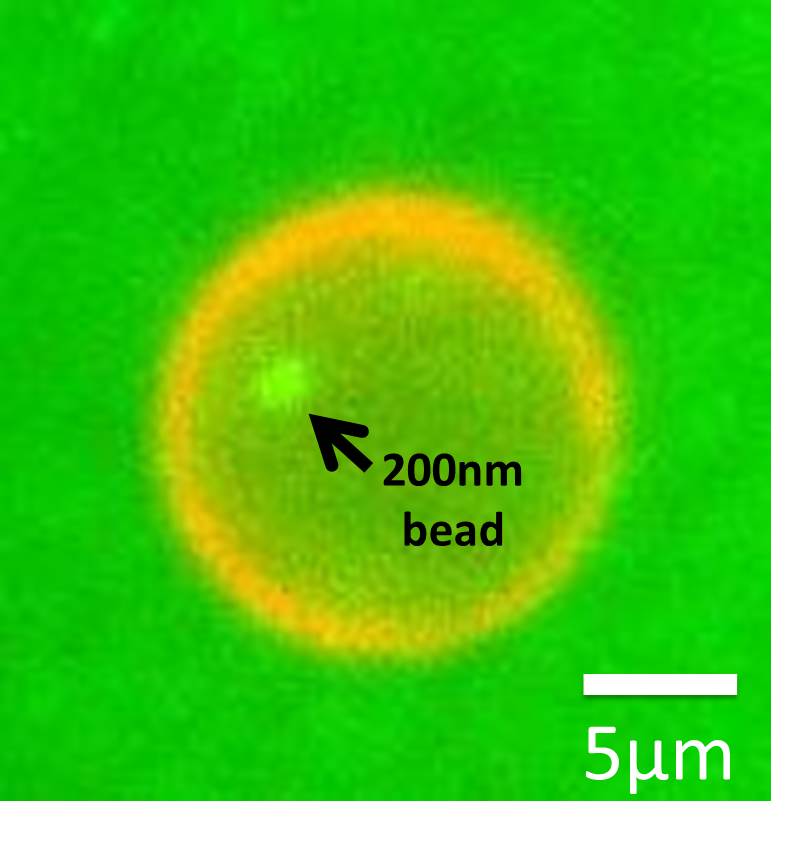
Fig. 10 DNA tile wrapping a 200 nm bead.
Green: the 200 nm bead, Red: EtBr-stained spherical DNA tile.
Conclusion
We succeeded in wrapping a sub-micrometer-sized object by adding Capture DNA and deforming DNA tile sheet into sphere-like structure. This result demonstrated the main concept of our design.